实验介绍 在本练习中,您将实现逻辑回归,并将其应用于两个不同的数据集
实验文件:
ex2.m:Octave/MATLAB脚本,帮助您完成练习
ex2_reg.m:m-Octave/MATLAB脚本,用于练习的后续部分
ex2data1.txt:txt-练习前半部分的训练集
ex2data2.txt:txt-练习后半部分的训练集
submit.m:将您的解决方案发送到我们的服务器
mapFeature.m:生成多项式特征的m函数
plotDecisionBoundary.m:绘制分类器决策界的函数
[?] plotData.m:绘制二维分类数据的函数
[?] sigmoid.m:Sigmoid函数(平滑的阶梯函数)
[?] costFunction.m:逻辑代价成本函数
[?] predict.m:逻辑回归预测函数
[?] costFunctionReg.m:正则化逻辑回归代价函数
Logistic Regression(逻辑回归) 在这部分练习中,你将建立一个逻辑回归模型来预测学生是否被大学录取:
假设你是一所大学的系主任,你想根据两次考试的结果来确定每个申请人的入学机会,你有以前申请者的历史数据,可以用作逻辑回归的训练集
对于每个培训示例,您都有申请人的两次考试成绩和录取决定
你的任务是建立一个分类模型,根据这两次考试的分数来估计申请人的入学概率
这是一个典型的监督分类问题,学生只有录取和不录取两种可能,而我们需要评估这两种可能的概率
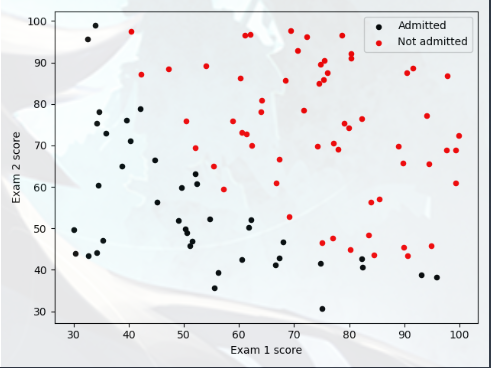
Visualizing the data A(可视化数据) 在开始实施任何学习算法之前,如果可能,最好将数据可视化,将加载数据,并通过调用函数 plotData 将其显示在二维绘图上
先看看 plotData 函数:
1
2
3
4
5
6
7
8
9
import matplotlib.pyplot as pltdef plot_data (X,Y ): plt.figure(); pos = Y == 1 neg = Y == 0 plt.scatter(X[neg,0 ],X[neg,1 ],c='black' ,marker='o' ,s=20 ) plt.scatter(X[pos,0 ],X[pos,1 ],c='red' ,marker='o' ,s=20 )
scatter:设置图表上的断点
注意:只有对应的 “neg” “pos” 为 True 时,才会被导入 scatter
具体实现:
1
2
3
4
5
6
7
8
9
10
11
12
13
import matplotlib.pyplot as plt import numpy as np dataset = np.loadtxt('data\ex2data1.txt' ,delimiter =',' ) X = dataset[:,0 :2 ] Y = dataset[:,2 ] plot_data(X,Y) plt.legend(['Admitted' , 'Not admitted' ]) plt.xlabel('Exam 1 score' ) plt.ylabel('Exam 2 score' ) plt.show()
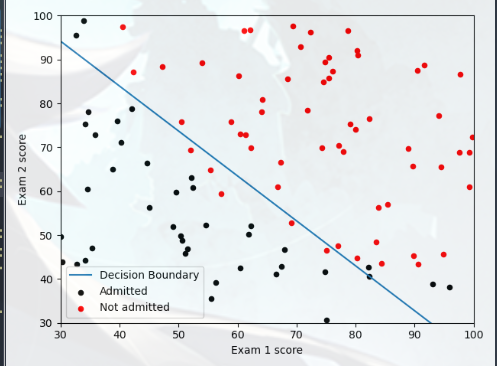
通过观察图像:决策边界(Decision Boundary)就是一条直线(不需要在特征中添加格外的多项式)
Cost function and gradient A(代价函数与梯度) 现在,您将实现逻辑回归的代价函数和梯度下降,在 costFunction 中完成代码,返回代价和梯度
逻辑回归的代价函数为交叉熵 ,公式如下:
costFunction 函数的实现:(这里已经是带有正则的形式了,但只要 lmd 为“0”就没有影响)
1
2
3
4
5
6
7
8
9
10
11
12
13
14
15
16
import numpy as npfrom sigmoid import sigmoiddef cost_Function_Reg (X,Y,theta,lmd ): m = X.shape[0 ] Z = np.dot(X,theta) g = sigmoid(Z) cost = - (Y.T).dot(np.log(g)) - ((1 -Y).T).dot(np.log(1 -g)) cost = cost /(m) + lmd * (theta.T).dot(theta) / (2 *m) grad = (X.T).dot(g-Y.reshape(Y.size))/ m grad[0 ] = grad[0 ] grad[1 :] = grad[1 :] + (lmd * theta[1 :])/m return cost,grad
array.T:二维数组转置
dot(x , y):两个数组作矩阵乘积,当两个数组的维度不能直接进行矩阵乘法时,dot会把尝试后面的参数进行转置
这个 sigmoid 就是“假设陈述”:
1
2
3
4
5
import numpy as npdef sigmoid (z ): g = 1 /(1 +np.exp(-z)) return g
整个式子就相当于:(标准的 Sigmoid 函数)
实现主体:
1 2 3 4 5 6 7 8 9 10 11 12 13 14 15 16 17 18 (m,n) = X.shape X = np.c_[np.ones(m),X] init_theta = np.zeros(X.shape[1 ]) lmd = 0 cost,grad = cf.cost_Function_Reg(X,Y,init_theta,lmd) print ('Cost at initial theta (zeros): {:0.3f}' .format (cost))print ('Expected cost (approx): 0.693' )print ('Gradient at initial theta (zeros): \n{}' .format (grad))print ('Expected gradients (approx): \n-0.1000\n-12.0092\n-11.2628' )test_theta = np.array([-24 ,0.2 ,0.2 ]) cost, grad = cf.cost_Function_Reg(X,Y,test_theta,0 ) print ('Cost at test theta (zeros): {:0.3f}' .format (cost))print ('Expected cost (approx): 0.218' )print ('Gradient at test theta: \n{}' .format (grad))print ('Expected gradients (approx): 0.043, 2.566, 2.647' )
Learning parameters using fminunc A(学习使用fminunc) 在上一个作业中,您通过实现梯度下降找到了线性回归模型的最佳参数:你写了一个代价函数,计算了它的梯度,然后相应地进行了梯度下降
这一次,您将使用一个名为 fminunc 的函数,而不是采用梯度下降步骤
Octave/MATLAB 的 fminunc 是一个优化解算器,可以找到无约束函数的最小值,对于逻辑回归,需要优化成本函数 J(θ),具体来说,您将使用 fminunc 找到最佳参数 θ 对于逻辑回归成本函数 J(θ)
实现如下:(使用 fminunc 进行拟合)
1
2
3
4
5
6
7
8
9
10
11
12
13
14
15
16
17
18
19
20
import scipy.optimize as opt def cost_func (t ): return cf.cost_Function_Reg(X,Y,t,0 )[0 ] def grad_func (t ): return cf.cost_Function_Reg(X,Y,t,0 )[1 ] theta, cost, *unused = opt.fmin_bfgs(f=cost_func, fprime=grad_func, x0=init_theta, maxiter=400 , full_output=True , disp=False ) print ('Cost at theta found by fmin: {:0.3f}' .format (cost)) print ('Expected cost (approx): 0.203' )print ('theta: \n{}' .format (theta))print ('Expected Theta (approx): \n-25.161\n0.206\n0.201' )pdb.plot_Decision_Boundary(X,Y,theta) plt.xlabel('Exam 1 score' ) plt.ylabel('Exam 2 score' ) plt.show()
效果如下:
最后看一下 plot_Decision_Boundary 的实现:
1
2
3
4
5
6
7
8
9
10
11
12
13
14
15
16
17
18
19
20
21
22
23
24
25
26
27
28
29
30
31
32
33
def plot_Decision_Boundary (X,Y,theta ): plot_data(X[:,1 :3 ],Y) if X.shape[1 ] <= 3 : plot_x = np.array([np.min (X[:,1 ])-2 ,np.max (X[:,1 ])+2 ]) plot_y = (-1 /theta[2 ]) * (theta[1 ]*plot_x + theta[0 ]) plt.plot(plot_x,plot_y) plt.legend(['Decision Boundary' , 'Admitted' , 'Not admitted' ]) plt.axis([30 ,100 ,30 ,100 ]) else : u = np.linspace(-1 ,1.5 ,50 ) v = np.linspace(-1 ,1.5 ,50 ) z = np.zeros((u.size,v.size)) for i in range (0 ,u.size): for j in range (0 ,v.size): z[i,j] = np.dot(map_feature(u[i],v[j],6 ),theta,) z = z.T cs = plt.contour(u,v,z,level=[0 ],colors='b' ,label='Decision Boundary' ) plt.legend([cs.collections[0 ]], ['Decision Boundary' ]) def map_feature (x1,x2,power ): x1 = x1.reshape((x1.size,1 )) x2 = x2.reshape((x2.size,1 )) result = np.ones(x1[:,0 ].shape) for i in range (1 ,power+1 ): for j in range (0 ,i+1 ): result = np.c_[result,(x1**(i-j))*(x2**j)] return result
Evaluating logistic regression(评估逻辑回归) 在学习了这些参数之后,您可以使用该模型来预测某个特定的学生是否会被录取:
对于一次考试成绩为45分、二次考试成绩为85分的学生,你应该预计入学概率为0.776
1
2
3
4
5
6
7
8
9
10
11
12
13
14
15
16
17
from sigmoid import sigmoidfrom predict import predictprob = sigmoid(np.array([1 , 45 , 85 ]).T.dot(theta)) print ('For a student with scores 45 and 85, we predict an admission probability of {:0.4f}' .format (prob))print ('Expected value : 0.775 +/- 0.002' )P = predict(X,theta) print ('Train accuracy:{}' .format (np.mean(P == Y)*100 )) print ('Expected accuracy (approx): 89.0' ) def predict (X,theta ): P = sigmoid(X.dot(theta)) P[P>=0.5 ] = 1 P[P<0.5 ] = 0 return P
Regularized Logistic Regression(正则逻辑回归) 在本部分练习中,您将实施正则化逻辑回归,以预测制造厂的微芯片是否通过质量保证(QA)
在QA过程中,每个微芯片都要经过各种测试,以确保其功能正常:
假设你是工厂的产品经理,你有一些微芯片在两次测试中的测试结果
从这两个测试中,您可以确定是否应该接受或拒绝微芯片
为了帮助你做出决定,你有一个关于过去微芯片测试结果的数据集,从中你可以建立一个逻辑回归模型
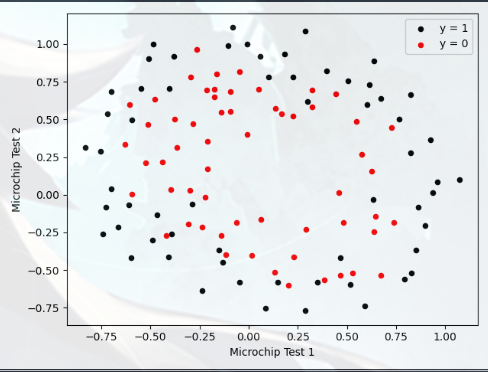
Visualizing the data B(可视化数据) 与本练习的前几部分类似,plotData 用于生成图形:
1 2 3 4 5 6 7 8 9 10 11 12 data = np.loadtxt('data\ex2data2.txt' , delimiter=',' ) X = data[:, 0 :2 ] y = data[:, 2 ] plot_data(X, y) plt.xlabel('Microchip Test 1' ) plt.ylabel('Microchip Test 2' ) plt.legend(['y = 1' , 'y = 0' ]) plt.show()
可以发现:大概是一个二次的模型
如果参数θ过少,代价函数就会过大(欠拟合)
如果参数θ过多,代价函数足够小了,但是泛化能力下降(过拟合)
所以考虑使用正则来平衡过拟合的影响
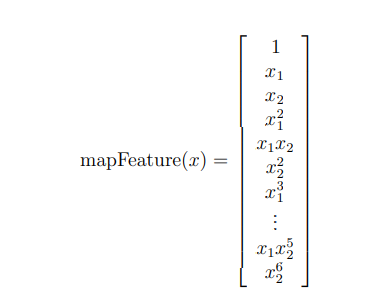
Feature mapping(特征映射) 更好地拟合数据的方法是从每个数据点创建更多特征
在提供的函数 mapFeature 中:我们将把这些特征映射成x1和x2的所有多项式项,直到六次方
作为这种映射的结果,我们的两个特征向量(两次QA测试的分数)已转换为28维向量
在这个高维特征向量上训练的逻辑回归分类器将具有更复杂的决策边界,并且在我们的二维图中绘制时将呈现非线性
虽然特征映射允许我们构建更具表现力的分类器,但它也更容易过度拟合
在本练习的下一部分中,您将实施正则化逻辑回归来拟合数据,并亲自了解正则化如何帮助解决过度拟合问题
Cost function and gradient B(代价函数与梯度) 现在,您将实现用于计算正则逻辑回归的代价函数和梯度的代码:完成 costFunctionReg 中的代码,返回成本和梯度
正则化交叉熵公式:
实现如下:
1
2
3
4
5
6
7
8
9
10
11
12
13
14
15
16
17
from costFunction import cost_Function_Reg X = mf.map_feature(X[:, 0 ], X[:, 1 ],6 ) print (X.shape)initial_theta = np.zeros(X.shape[1 ]) lmd = 1 cost, grad = cost_Function_Reg (X, y,initial_theta, lmd) np.set_printoptions(formatter={'float' : '{: 0.4f}\n' .format }) print ('Cost at initial theta (zeros): {: 0.4f}' .format (cost))print ('Expected cost (approx): 0.693' )print ('Gradient at initial theta (zeros) - first five values only: \n{}' .format (grad[0 :5 ]))print ('Expected gradients (approx) - first five values only: \n 0.0085\n 0.0188\n 0.0001\n 0.0503\n 0.0115' )
Learning parameters using fminunc B(学习使用fminunc) 这个和上一个板块的区别不大,只要设置 λ 非零就好了:
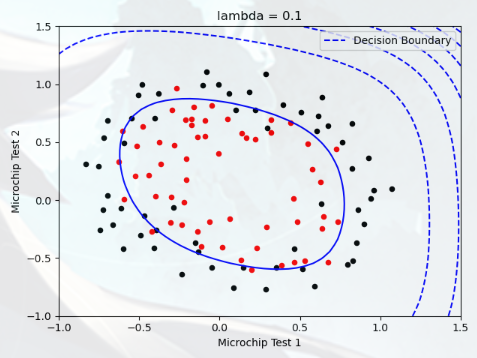
1 2 3 4 5 6 7 8 9 10 11 12 13 14 15 16 17 18 19 20 21 22 23 24 25 initial_theta = np.zeros(X.shape[1 ]) lmd = 1 def cost_func (t ): return cost_Function_Reg(X, y,t, lmd)[0 ] def grad_func (t ): return cost_Function_Reg(X, y,t, lmd)[1 ] theta, cost, *unused = opt.fmin_bfgs(f=cost_func, fprime=grad_func, x0=initial_theta, maxiter=400 , full_output=True , disp=False ) print ('Plotting decision boundary ...' )pdb.plot_Decision_Boundary( X, y,theta) plt.title('lambda = {}' .format (lmd)) plt.xlabel('Microchip Test 1' ) plt.ylabel('Microchip Test 2' ) plt.show() p = predict.predict( X,theta) print ('Train Accuracy: {:0.4f}' .format (np.mean(y == p) * 100 ))print ('Expected accuracy (with lambda = 1): 83.1 (approx)' )
绘图结果:
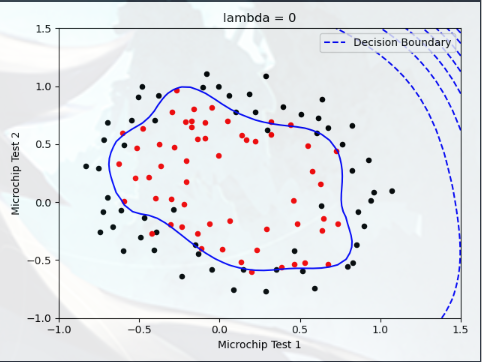
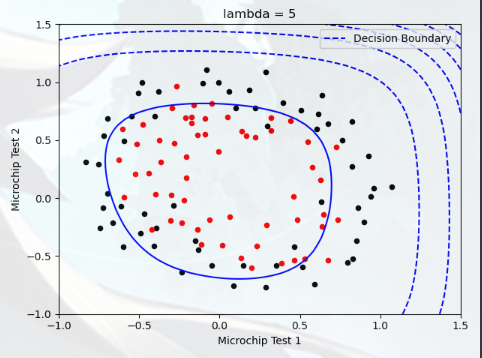
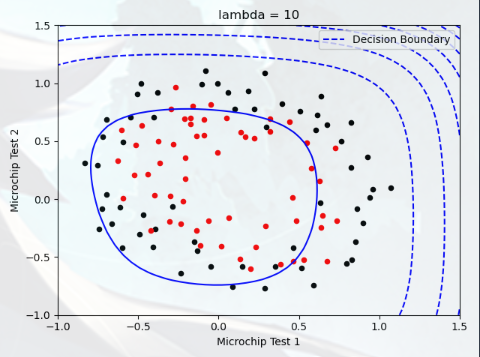
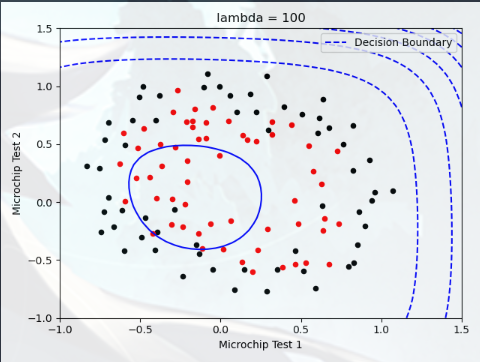
Plotting the decision boundary(绘制决策边界) 在本部分中,我们需要绘制出决策边界,您将尝试 lambda 的不同值,查看正则化如何影响决策边界
尝试以下 lambda 值(0、5、10、100)
观察决策边界图形的不同
查看训练集的准确度是否各不相同
实验1,lambda = 0:
实验2,lambda = 5:
实验3,lambda = 10:
实验4,lambda = 100:
