cd $HOME/tiff-4.0.4/ make clean CFLAGS="--coverage" LDFLAGS="--coverage" ./configure --prefix="$HOME/fuzzing_tiff/install/" --disable-shared make make install
TIFFReadDirectory: Warning, Bogus "StripByteCounts" field, ignoring and calculating from imagelength. TIFF Directory at offset 0xbd4 (3028) Image Width: 157 Image Length: 151 Bits/Sample: 1537 Sample Format: unsigned integer Compression Scheme: None Photometric Interpretation: palette color(RGB from colormap) Samples/Pixel: 1 Rows/Strip: 409 Planar Configuration: single image plane Page Number: 0-1 Color Map: AddressSanitizer:DEADLYSIGNAL ================================================================= ==3472169==ERROR: AddressSanitizer: SEGV on unknown address 0x000000000000 (pc 0x00000046e5f3 bp 0x7ffdb4e2bf10 sp 0x7ffdb4e2bd80 T0) ==3472169==The signal is caused by a READ memory access. ==3472169==Hint: address points to the zero page. #00x46e5f3 in TIFFPrintDirectory /home/yhellow/tiff-4.0.4/libtiff/tif_print.c #10x33fbad in tiffinfo /home/yhellow/tiff-4.0.4/tools/tiffinfo.c:449:2 #20x33f1d4 in main /home/yhellow/tiff-4.0.4/tools/tiffinfo.c:152:6 #30x7f60e75b6082 in __libc_start_main /build/glibc-SzIz7B/glibc-2.31/csu/../csu/libc-start.c:308:16 #40x29165d in _start (/home/yhellow/fuzzing_tiff/install/bin/tiffinfo+0x29165d)
AddressSanitizer can not provide additional info. SUMMARY: AddressSanitizer: SEGV /home/yhellow/tiff-4.0.4/libtiff/tif_print.c in TIFFPrintDirectory ==3472169==ABORTING
TIFFReadDirectoryCheckOrder: Warning, Invalid TIFF directory; tags are not sorted in ascending order. TIFFReadDirectory: Warning, Unknown field with tag 7217 (0x1c31) encountered. TIFF Directory at offset 0xbd4 (3028) Image Width: 157 Image Length: 151 Bits/Sample: 1 Sample Format: unsigned integer Compression Scheme: None Photometric Interpretation: palette color(RGB from colormap) Samples/Pixel: 1 Rows/Strip: 409 Planar Configuration: single image plane Page Number: 0-1 Color Map: 0: 29281 26979 24935 1: 28776 29517 26979 DocumentName: palette-1c-1b.tiff ================================================================= ==3582061==ERROR: AddressSanitizer: heap-buffer-overflow on address 0x6070000000d1 at pc 0x0000002aadf2 bp 0x7ffc31f49e70 sp 0x7ffc31f49630 READ of size 66 at 0x6070000000d1 thread T0 #00x2aadf1 in fputs (/home/yhellow/fuzzing_tiff/install/bin/tiffinfo+0x2aadf1) #10x47068f in _TIFFPrintField /home/yhellow/tiff-4.0.4/libtiff/tif_print.c:127:4 #20x47068f in TIFFPrintDirectory /home/yhellow/tiff-4.0.4/libtiff/tif_print.c:641:5 #30x33fbad in tiffinfo /home/yhellow/tiff-4.0.4/tools/tiffinfo.c:449:2 #40x33f1d4 in main /home/yhellow/tiff-4.0.4/tools/tiffinfo.c:152:6 #50x7f68b28f1082 in __libc_start_main /build/glibc-SzIz7B/glibc-2.31/csu/../csu/libc-start.c:308:16 #60x29165d in _start (/home/yhellow/fuzzing_tiff/install/bin/tiffinfo+0x29165d)
0x6070000000d1 is located 0 bytes to the right of 65-byte region [0x607000000090,0x6070000000d1) allocated by thread T0 here: #00x30b6cd in malloc (/home/yhellow/fuzzing_tiff/install/bin/tiffinfo+0x30b6cd) #10x3564d5 in _TIFFmalloc /home/yhellow/tiff-4.0.4/libtiff/tif_unix.c:283:10 #20x3564d5 in setByteArray /home/yhellow/tiff-4.0.4/libtiff/tif_dir.c:51:19 #30x3564d5 in _TIFFVSetField /home/yhellow/tiff-4.0.4/libtiff/tif_dir.c:539:4 #40x34c2d6 in TIFFVSetField /home/yhellow/tiff-4.0.4/libtiff/tif_dir.c:820:6 #50x34c2d6 in TIFFSetField /home/yhellow/tiff-4.0.4/libtiff/tif_dir.c:764:11 #60x38464e in TIFFFetchNormalTag /home/yhellow/tiff-4.0.4/libtiff/tif_dirread.c:5164:8 #70x377976 in TIFFReadDirectory /home/yhellow/tiff-4.0.4/libtiff/tif_dirread.c:3810:12 #80x433bc9 in TIFFClientOpen /home/yhellow/tiff-4.0.4/libtiff/tif_open.c:466:8 #90x33ef47 in TIFFFdOpen /home/yhellow/tiff-4.0.4/libtiff/tif_unix.c:178:8 #100x33ef47 in TIFFOpen /home/yhellow/tiff-4.0.4/libtiff/tif_unix.c:217:8 #110x33ef47 in main /home/yhellow/tiff-4.0.4/tools/tiffinfo.c:140:9 #120x7f68b28f1082 in __libc_start_main /build/glibc-SzIz7B/glibc-2.31/csu/../csu/libc-start.c:308:16
SUMMARY: AddressSanitizer: heap-buffer-overflow (/home/yhellow/fuzzing_tiff/install/bin/tiffinfo+0x2aadf1) in fputs Shadow bytes around the buggy address: 0x0c0e7fff7fc0: 00000000000000000000000000000000 0x0c0e7fff7fd0: 00000000000000000000000000000000 0x0c0e7fff7fe0: 00000000000000000000000000000000 0x0c0e7fff7ff0: 00000000000000000000000000000000 0x0c0e7fff8000: fa fa fa fa fd fd fd fd fd fd fd fd fd fa fa fa =>0x0c0e7fff8010: fa fa 0000000000000000[01]fa fa fa fa fa 0x0c0e7fff8020: fa fa fa fa fa fa fa fa fa fa fa fa fa fa fa fa 0x0c0e7fff8030: fa fa fa fa fa fa fa fa fa fa fa fa fa fa fa fa 0x0c0e7fff8040: fa fa fa fa fa fa fa fa fa fa fa fa fa fa fa fa 0x0c0e7fff8050: fa fa fa fa fa fa fa fa fa fa fa fa fa fa fa fa 0x0c0e7fff8060: fa fa fa fa fa fa fa fa fa fa fa fa fa fa fa fa Shadow byte legend (one shadow byte represents 8 application bytes): Addressable: 00 Partially addressable: 01020304050607 Heap left redzone: fa Freed heap region: fd Stack left redzone: f1 Stack mid redzone: f2 Stack right redzone: f3 Stack after return: f5 Stack use after scope: f8 Global redzone: f9 Global init order: f6 Poisoned by user: f7 Container overflow: fc Array cookie: ac Intra object redzone: bb ASan internal: fe Left alloca redzone: ca Right alloca redzone: cb Shadow gap: cc ==3582061==ABORTING
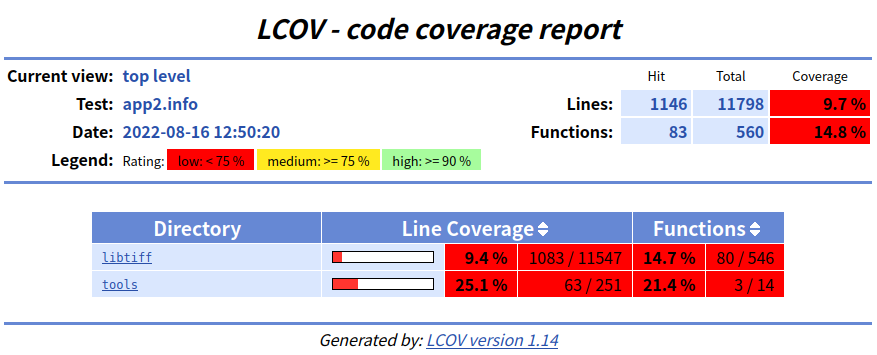
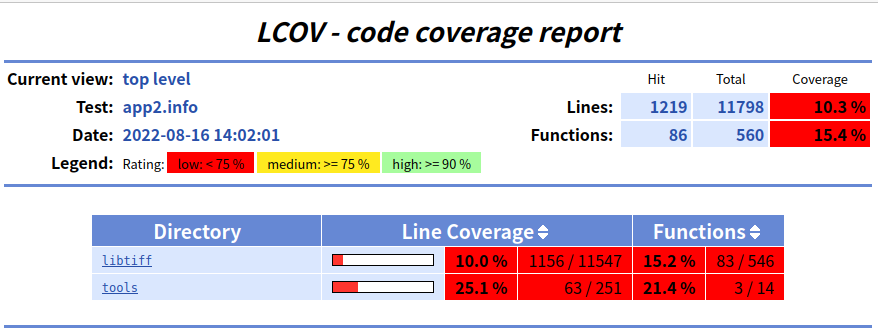
cd $HOME/tiff-4.0.4/ make clean CFLAGS="--coverage" LDFLAGS="--coverage" ./configure --prefix="$HOME/fuzzing_tiff/coverage/" --disable-shared make make install
➜ bin ./tiffinfo test TIFFReadDirectoryCheckOrder: Warning, Invalid TIFF directory; tags are not sorted in ascending order. TIFFReadDirectory: Warning, Unknown field with tag 7217 (0x1c31) encountered. TIFF Directory at offset 0xbd4 (3028) Image Width: 157 Image Length: 151 Bits/Sample: 1 Sample Format: unsigned integer Compression Scheme: None Photometric Interpretation: palette color(RGB from colormap) Samples/Pixel: 1 Rows/Strip: 409 Planar Configuration: single image plane Page Number: 0-1 Color Map: (present) DocumentName: palette-1c-1b.tiff Tag 7217: GraphicsMagick 1.2 unreleased Q16 http://ww��������������������w.#)
发现程序的输出异常,我们先利用 ASan 进行调试,ASan 提供的报错信息如下:
1 2 3 4 5 6 7 8 9 10 11 12 13 14 15 16 17 18
==3333==ERROR: AddressSanitizer: heap-buffer-overflow on address 0x6070000000d1 at pc 0x0000002aadf2 bp 0x7fffffffda30 sp 0x7fffffffd1f0 READ of size 66 at 0x6070000000d1 thread T0 [Attaching after Thread 0x7ffff7c01800 (LWP 3333) fork to child process 3337] [New inferior 2 (process 3337)] [Detaching after fork from parent process 3333] [Inferior 1 (process 3333) detached] [Thread debugging using libthread_db enabled] Using host libthread_db library "/lib/x86_64-linux-gnu/libthread_db.so.1". process 3337 is executing new program: /usr/lib/llvm-11/bin/llvm-symbolizer [Thread debugging using libthread_db enabled] Using host libthread_db library "/lib/x86_64-linux-gnu/libthread_db.so.1". #00x2aadf1 in fputs (/home/yhellow/fuzzing_tiff/install/bin/tiffinfo+0x2aadf1) #10x47068f in _TIFFPrintField /home/yhellow/tiff-4.0.4/libtiff/tif_print.c:127:4 #20x47068f in TIFFPrintDirectory /home/yhellow/tiff-4.0.4/libtiff/tif_print.c:641:5 #30x33fbad in tiffinfo /home/yhellow/tiff-4.0.4/tools/tiffinfo.c:449:2 #40x33f1d4 in main /home/yhellow/tiff-4.0.4/tools/tiffinfo.c:152:6 #50x7ffff7c28082 in __libc_start_main /build/glibc-SzIz7B/glibc-2.31/csu/../csu/libc-start.c:308:16 #60x29165d in _start (/home/yhellow/fuzzing_tiff/install/bin/tiffinfo+0x29165d)