0%

Fuzz Lab3-TCPdump

Fuzz-Lab3:TCPdump

在本练习中,我们将 fuzz TCPdump 数据包分析器(截取网络分组,并输出分组内容的工具),目标是在 TCPdump 4.9.2 中找到 [CVE-2017-13028] 的 crash/PoC

  • CVE-2017-13028 是一个越界读取漏洞,可以通过 BOOTP 数据包(引导协议)触发
    • 越界读取是当程序读取超出预期缓冲区末尾或开头之前的数据时发生的漏洞
    • 结果,它允许远程攻击者导致拒绝服务或可能从进程内存中获取潜在的敏感信息

学习的目标:

  • 什么是 ASan (Address Sanitizer),一个运行时内存错误检测工具
  • 如何使用 ASAN 对目标进行模糊测试
  • 使用 ASan 对崩溃进行分类有多容易

Do it yourself!

为了完成这个练习,你需要:

  • 找到一种对 TCPdump 进行模糊测试的有效方法
  • 尝试弄清楚如何启用 ASan 进行模糊测试
  • Fuzz TCPdump,直到你有一些独特的崩溃
  • 对崩溃进行分类以找到漏洞的 PoC
  • 修复问题

Download and build your target

1
2
3
4
5
6
7
8
9
10
11
12
13
14
15
16
17
18
19
20
cd $HOME
mkdir fuzzing_tcpdump && cd fuzzing_tcpdump/

cd ..
wget https://github.com/the-tcpdump-group/tcpdump/archive/refs/tags/tcpdump-4.9.2.tar.gz # 下载tcpdump-4.9.2.tar.gz
tar -xzvf tcpdump-4.9.2.tar.gz

wget https://github.com/the-tcpdump-group/libpcap/archive/refs/tags/libpcap-1.8.0.tar.gz # 下载TCPdump需要的跨平台库libpcap
tar -xzvf libpcap-1.8.0.tar.gz

mv libpcap-libpcap-1.8.0/ libpcap-1.8.0 # 将libpcap-libpcap-1.8.0重命名为libpcap-1.8.0(否则tcpdump找不到libpcap.a本地路径)

cd $HOME/libpcap-1.8.0/ # 构建和安装libpcap
./configure --enable-shared=no
make

cd $HOME/tcpdump-tcpdump-4.9.2/ # 构建和安装tcpdump
./configure --prefix="$HOME/fuzzing_tcpdump/install2/"
make
make install

要测试一切是否正常,只需键入:

1
$HOME/fuzzing_tcpdump/install2/sbin/tcpdump -h

结果:

1
2
3
4
5
6
7
8
9
10
11
tcpdump version 4.9.2
libpcap version 1.8.0
OpenSSL 1.1.1f 31 Mar 2020
Usage: tcpdump [-aAbdDefhHIJKlLnNOpqStuUvxX#] [ -B size ] [ -c count ]
[ -C file_size ] [ -E algo:secret ] [ -F file ] [ -G seconds ]
[ -i interface ] [ -j tstamptype ] [ -M secret ] [ --number ]
[ -Q in|out|inout ]
[ -r file ] [ -s snaplen ] [ --time-stamp-precision precision ]
[ --immediate-mode ] [ -T type ] [ --version ] [ -V file ]
[ -w file ] [ -W filecount ] [ -y datalinktype ] [ -z postrotate-command ]
[ -Z user ] [ expression ]

Seed corpus creation

您可以在 tests 文件夹中找到很多 .pcap 示例。 您可以使用以下命令行运行这些 .pcap 文件:

1
$HOME/fuzzing_tcpdump/install/sbin/tcpdump -vvvvXX -ee -nn -r ./tests/geneve.pcap
  • pcap 文件是常用的数据报存储格式(拖入 wireshark 就可以直接查看),可以理解为就是一种文件格式,只不过里面的数据是按照特定格式存储的
  • 所以我们想要解析里面的数据,也必须按照一定的格式,比如使用 wireshark 或者 tcpdump

结果:

1
2
3
4
5
6
7
8
9
10
11
12
13
14
15
16
17
18
reading from file ./tests/geneve.pcap, link-type EN10MB (Ethernet)
06:04:33.817203 00:1b:21:3c:ab:64 > 00:1b:21:3c:ac:30, ethertype IPv4 (0x0800), length 156: (tos 0x0, ttl 64, id 57261, offset 0, flags [DF], proto UDP (17), length 142)
20.0.0.1.12618 > 20.0.0.2.6081: [no cksum] Geneve, Flags [C], vni 0xa, proto TEB (0x6558), options [class Standard (0x0) type 0x80(C) len 8 data 0000000c]
b6:9e:d2:49:51:48 > fe:71:d8:83:72:4f, ethertype IPv4 (0x0800), length 98: (tos 0x0, ttl 64, id 48546, offset 0, flags [DF], proto ICMP (1), length 84)
30.0.0.1 > 30.0.0.2: ICMP echo request, id 10578, seq 23, length 64
0x0000: 001b 213c ac30 001b 213c ab64 0800 4500 ..!<.0..!<.d..E.
0x0010: 008e dfad 4000 4011 32af 1400 0001 1400 ....@.@.2.......
0x0020: 0002 314a 17c1 007a 0000 0240 6558 0000 ..1J...z...@eX..
0x0030: 0a00 0000 8001 0000 000c fe71 d883 724f ...........q..rO
0x0040: b69e d249 5148 0800 4500 0054 bda2 4000 ...IQH..E..T..@.
0x0050: 4001 4104 1e00 0001 1e00 0002 0800 2c54 @.A...........,T
0x0060: 2952 0017 f1a2 ce54 0000 0000 1778 0c00 )R.....T.....x..
0x0070: 0000 0000 1011 1213 1415 1617 1819 1a1b ................
0x0080: 1c1d 1e1f 2021 2223 2425 2627 2829 2a2b .....!"#$%&'()*+
0x0090: 2c2d 2e2f 3031 3233 3435 3637 ,-./01234567
06:04:33.817454 00:1b:21:3c:ac:30 > 00:1b:21:3c:ab:64, ethertype IPv4 (0x0800), length 148: (tos 0x0, ttl 64, id 34821, offset 0, flags [DF], proto UDP (17), length 134)

......
  • 和 wireshark 显示的结果大同小异

AddressSanitizer

AddressSanitizer (ASan) 是用于 C 和 C++ 的快速内存错误检测器

  • 它最初由 Google(Konstantin Serebryany、Derek Bruening、Alexander Potapenko、Dmitry Vyukov)开发,并于 2011 年 5 月首次发布
  • 它由一个编译器检测模块和一个运行时库组成,该工具能够发现对堆、堆栈和全局对象的越界访问,以及释放后使用、双重释放和内存泄漏错误
  • AddressSanitizer 是开源的,从 3.1 版开始与 LLVM 编译器工具链集成,虽然它最初是作为 LLVM 项目开发的,但它已被移植到 GCC 并包含在 >= 4.8 的 GCC 版本中

现在我们将构建启用 ASAN 的 tcpdump(和 libpcap),首先,我们要清理所有以前编译的目标文件和可执行文件:

1
2
3
4
5
cd $HOME/libpcap-1.8.0/
make clean

cd $HOME/tcpdump-tcpdump-4.9.2/
make clean

现在,我们在调用“configure”和“make”之前设置“AFL_USE_ASAN=1”:

1
2
3
4
5
6
7
8
9
10
cd $HOME/libpcap-1.8.0/
export LLVM_CONFIG="llvm-config-11"
CC=afl-clang-lto ./configure --enable-shared=no --prefix="$HOME/fuzzing_tcpdump/install/"
AFL_USE_ASAN=1 make
AFL_USE_ASAN=1 make install

cd $HOME/tcpdump-tcpdump-4.9.2/
AFL_USE_ASAN=1 CC=afl-clang-lto ./configure --prefix="$HOME/fuzzing_tcpdump/install/"
AFL_USE_ASAN=1 make
AFL_USE_ASAN=1 make install

Fuzz TCPdump

1
afl-fuzz -m none -i $HOME/tcpdump-tcpdump-4.9.2/tests/ -o $HOME/fuzzing_tcpdump/out/ -s 123 -- $HOME/fuzzing_tcpdump/install/sbin/tcpdump -vvvvXX -ee -nn -r @@
  • 注意:64 位系统上的 ASAN 需要大量虚拟内存,需要设置了标志 “-m none” 来禁用 AFL 中的内存限制
  • PS:4小时,太慢了~~

Triage

调试使用 ASan 构建的程序比前面的练习要容易得多,您需要做的就是向程序提供崩溃文件:

1
$HOME/fuzzing_tcpdump/install/sbin/tcpdump -vvvvXX -ee -nn -r ./id:000000,sig:06,src:005014,time:6037115,execs:4952858,op:havoc,rep:16

结果如下:

1
2
3
4
5
6
7
8
9
10
11
12
13
14
15
16
17
18
19
20
21
22
23
24
25
26
27
28
29
30
31
32
33
34
35
36
37
38
39
40
41
42
43
44
45
46
47
48
49
50
51
52
53
54
55
56
57
58
59
60
61
62
63
64
65
66
67
68
69
70
71
72
73
74
75
76
77
78
79
80
81
82
83
84
85
86
87
88
89
90
91
92
93
94
95
96
97
98
99
100
101
102
103
104
105
106
107
Warning: AFL++ tools might need to set AFL_MAP_SIZE to 84065 to be able to run this instrumented program if this crashes!
reading from file ./id:000000,sig:06,src:005014,time:6037115,execs:4952858,op:havoc,rep:16, link-type EN10MB (Ethernet)
04:27:12.000006 01:01:01:0d:01:01 > ed:e9:ff:ff:ff:ff, ethertype IPv4 (0x0800), length 67: truncated-ip - 2607 bytes missing! (tos 0xe5,ECT(1), ttl 252, id 8264, offset 0, flags [none], proto UDP (17), length 2660, bad cksum 121 (->d6d1)!)
222.241.104.198.53 > 131.63.241.146.67: 212 op8 ServFail|$ [41218q] q: Type212 (Class 50098)? ., q:[|domain]
0x0000: ede9 ffff ffff 0101 010d 0101 0800 45e5 ..............E.
0x0010: 0a64 2048 0000 fc11 0121 def1 68c6 833f .d.H.....!..h..?
0x0020: f192 0035 0043 1800 5002 00d4 c3b2 a102 ...5.C..P.......
0x0030: 0004 0000 0000 0000 d4c3 b2a1 0200 0400 ................
0x0040: 0000 0001 0000 0000 5d00 0000 ........]...
08:01:59.1399853056 59:59:d4:c3:b2:a1 > 00:00:00:00:00:71, 802.3, length 512: LLC, dsap SNA (0x04) Individual, ssap Null (0x00) Command, ctrl 0x0000: Information, send seq 0, rcv seq 0, Flags [Command], length 587271413
0x0000: 0000 0000 0071 5959 d4c3 b2a1 0200 0400 .....qYY........
0x0010: 0000 0000 0000 0000 ffff 0000 0100 0000 ................
23:17:28.958610 00:04:23:57:a5:7a > ff:ff:ff:ff:ef:ff, ethertype IPv4 (0x0800), length 221: (tos 0x0, ttl 128, id 14471, offset 0, flags [none], proto UDP (17), length 207)
192.168.1.249.138 > 192.168.1.255.138:
>>> NBT UDP PACKET(138) Res=0x110E ID=0x891D IP=192 (0xc0).168 (0xa8).1 (0x1).249 (0xf9) Port=650 (0x28a) Length=165 (0xa5) Res2=0x0
SourceName=DJP95S0J NameType=0x00 (Workstation)
DestName=ARBEITSGRUPPE NameType=0x00 (Workstation)

SMB PACKET: SMBtrans (REQUEST)
SMB Command = 0x25
Error class = 0x0
Error code = 0 (0x0)
Flags1 = 0x0
Flags2 = 0x0
Tree ID = 0 (0x0)
Proc ID = 0 (0x0)
UID = 0 (0x0)
MID = 0 (0x0)
Word Count = 17 (0x11)
TotParamCnt=0 (0x0)
TotDataCnt=11 (0xb)
MaxParmCnt=0 (0x0)
MaxDataCnt=0 (0x0)
MaxSCnt=0 (0x0)
TransFlags=0x0
Res1=0x3E9
Res2=0x0
Res3=0x0
ParamCnt=0 (0x0)
ParamOff=0 (0x0)
DataCnt=11 (0xb)
DataOff=86 (0x56)
SUCnt=3 (0x3)
Data: (6 bytes)
[000] 01 00 01 00 02 00 \0x01\0x00\0x01\0x00\0x02\0x00
smb_bcc=28
=================================================================
==2727==ERROR: AddressSanitizer: heap-buffer-overflow on address 0x611000000107 at pc 0x0000003d0235 bp 0x7ffc22dc8210 sp 0x7ffc22dc79b8 /* 对应代码的位置 */
READ of size 7 at 0x611000000107 thread T0 /* heap中的溢出点 */
#0 0x3d0234 in strcmp (/home/yhellow/fuzzing_tcpdump/install/sbin/tcpdump+0x3d0234)
#1 0x712469 in print_trans /home/yhellow/tcpdump-tcpdump-4.9.2/./print-smb.c:375:6
#2 0x713f6a in print_smb /home/yhellow/tcpdump-tcpdump-4.9.2/./print-smb.c:863:6
#3 0x6ec5e1 in nbt_udp138_print /home/yhellow/tcpdump-tcpdump-4.9.2/./print-smb.c:1307:6
#4 0x6ec5e1 in udp_print /home/yhellow/tcpdump-tcpdump-4.9.2/./print-udp.c:608:4
#5 0x55dfe8 in ip_print_demux /home/yhellow/tcpdump-tcpdump-4.9.2/./print-ip.c:402:3
#6 0x5616e5 in ip_print /home/yhellow/tcpdump-tcpdump-4.9.2/./print-ip.c:673:3
#7 0x51ac27 in ethertype_print /home/yhellow/tcpdump-tcpdump-4.9.2/./print-ether.c:333:10
#8 0x51996a in ether_print /home/yhellow/tcpdump-tcpdump-4.9.2/./print-ether.c:236:7
#9 0x4791ab in pretty_print_packet /home/yhellow/tcpdump-tcpdump-4.9.2/./print.c:332:18
#10 0x4791ab in print_packet /home/yhellow/tcpdump-tcpdump-4.9.2/./tcpdump.c:2497:2
#11 0x83da5d in pcap_offline_read /home/yhellow/libpcap-1.8.0/./savefile.c:507:4
#12 0x470c0c in pcap_loop /home/yhellow/libpcap-1.8.0/./pcap.c:875:8
#13 0x470c0c in main /home/yhellow/tcpdump-tcpdump-4.9.2/./tcpdump.c:2000:12
#14 0x7fa3263bb082 in __libc_start_main /build/glibc-SzIz7B/glibc-2.31/csu/../csu/libc-start.c:308:16
#15 0x3bcedd in _start (/home/yhellow/fuzzing_tcpdump/install/sbin/tcpdump+0x3bcedd)

0x611000000107 is located 0 bytes to the right of 199-byte region [0x611000000040,0x611000000107)
allocated by thread T0 here:
#0 0x436f4d in malloc (/home/yhellow/fuzzing_tcpdump/install/sbin/tcpdump+0x436f4d)
#1 0x83efd8 in pcap_check_header /home/yhellow/libpcap-1.8.0/./sf-pcap.c:401:14
#2 0x83ce1d in pcap_fopen_offline_with_tstamp_precision /home/yhellow/libpcap-1.8.0/./savefile.c:380:7
#3 0x83cb48 in pcap_open_offline_with_tstamp_precision /home/yhellow/libpcap-1.8.0/./savefile.c:287:6

SUMMARY: AddressSanitizer: heap-buffer-overflow (/home/yhellow/fuzzing_tcpdump/install/sbin/tcpdump+0x3d0234) in strcmp
Shadow bytes around the buggy address:
0x0c227fff7fd0: 00 00 00 00 00 00 00 00 00 00 00 00 00 00 00 00
0x0c227fff7fe0: 00 00 00 00 00 00 00 00 00 00 00 00 00 00 00 00
0x0c227fff7ff0: 00 00 00 00 00 00 00 00 00 00 00 00 00 00 00 00
0x0c227fff8000: fa fa fa fa fa fa fa fa 00 00 00 00 00 00 00 00
0x0c227fff8010: 00 00 00 00 00 00 00 00 00 00 00 00 00 00 00 00
=>0x0c227fff8020:[07]fa fa fa fa fa fa fa fa fa fa fa fa fa fa fa
0x0c227fff8030: fa fa fa fa fa fa fa fa fa fa fa fa fa fa fa fa
0x0c227fff8040: fa fa fa fa fa fa fa fa fa fa fa fa fa fa fa fa
0x0c227fff8050: fa fa fa fa fa fa fa fa fa fa fa fa fa fa fa fa
0x0c227fff8060: fa fa fa fa fa fa fa fa fa fa fa fa fa fa fa fa
0x0c227fff8070: fa fa fa fa fa fa fa fa fa fa fa fa fa fa fa fa
Shadow byte legend (one shadow byte represents 8 application bytes):
Addressable: 00
Partially addressable: 01 02 03 04 05 06 07
Heap left redzone: fa
Freed heap region: fd
Stack left redzone: f1
Stack mid redzone: f2
Stack right redzone: f3
Stack after return: f5
Stack use after scope: f8
Global redzone: f9
Global init order: f6
Poisoned by user: f7
Container overflow: fc
Array cookie: ac
Intra object redzone: bb
ASan internal: fe
Left alloca redzone: ca
Right alloca redzone: cb
Shadow gap: cc
==2727==ABORTING
  • 程序 crash 的原因为 heap-buffer-overflow(堆溢出)

[CVE-2017-13028] 的漏洞点是 bootp_print() ,而这里的漏洞点是 print_trans()

后来发现这个是 [CVE-2018-16451] 的漏洞点,因为没有 fuzz 出 [CVE-2017-13028] 的漏洞,而我又不想继续 fuzz 了,干脆就复现 [CVE-2018-16451] 算了

Reproduce the crash

1
gdb --args ./tcpdump -vvvvXX -ee -nn -r ./test
  • print_trans 打上断点,单步到执行 strcmp 的位置:
1
2
3
0x712465 <print_trans+1509>    call   strcmp                      <strcmp>
s1: 0x611000000101 ◂— 0x534c49414d5c /* '\\MAILS' */
s2: 0x34e960 (str.275) ◂— '\\MAILSLOT\\BROWSE'
  • 再次单步过后,ASan 检测到内存错误,并中断程序:
1
2
3
4
5
6
7
8
9
10
11
12
13
14
pwndbg> ni
=================================================================
==5418==ERROR: AddressSanitizer: heap-buffer-overflow on address 0x611000000107 at pc 0x0000003d0235 bp 0x7fffffffbb30 sp 0x7fffffffb2d8
READ of size 7 at 0x611000000107 thread T0
[Attaching after Thread 0x7ffff7947800 (LWP 5418) fork to child process 5422]
[New inferior 2 (process 5422)]
[Detaching after fork from parent process 5418]
[Inferior 1 (process 5418) detached]
[Thread debugging using libthread_db enabled]
Using host libthread_db library "/lib/x86_64-linux-gnu/libthread_db.so.1".
process 5422 is executing new program: /usr/lib/llvm-11/bin/llvm-symbolizer
Warning:
Cannot insert breakpoint 1.
Cannot access memory at address 0x712465
  • 我第一时间不清楚 ASan 给出的报错信息和程序漏洞之间的关系,所以跟进 strcmp 继续调试
1
0x3d0252 <strcmp+482>    call   0x43c5c0                      <0x43c5c0>
  • 一直跟进到 ASan 记录的地址:0x3d0235(我发现这个 strcmp 的地址有点怪,好像不在 libc 里面)
  • 对比该汇编指令执行前后 [rdx] 寄存器的变化:(讲真,这里我没有看出溢出点)
1
2
3
4
5
6
7
8
9
*RDX  0x14
RBP 0x7fffffffbb30 —▸ 0x611000000101 ◂— 0x534c49414d5c /* '\\MAILS' */
*RIP 0x3d0235 (strcmp+453) ◂— lea rdx, [rbp - 0x858]
──────────────────────────────────────────────────────────────────────────────────
0x3d0235 <strcmp+453> lea rdx, [rbp - 0x858]
0x3d023c <strcmp+460> mov rdi, rax
0x3d023f <strcmp+463> mov rsi, qword ptr [rbp - 0x40]
0x3d0243 <strcmp+467> mov rcx, qword ptr [rbp - 0x38]
0x3d0247 <strcmp+471> xor r8d, r8d
1
2
3
4
5
6
7
8
9
*RDX  0x7fffffffb2d8 —▸ 0x7ffff7b376a0 (_IO_2_1_stdout_) —▸ 0xfbad2a84 ◂— 0x0
RBP 0x7fffffffbb30 —▸ 0x611000000101 ◂— 0x534c49414d5c /* '\\MAILS' */
*RIP 0x3d023c (strcmp+460) ◂— mov rdi, rax
──────────────────────────────────────────────────────────────────────────────────
0x3d0235 <strcmp+453> lea rdx, [rbp - 0x858]
0x3d023c <strcmp+460> mov rdi, rax
0x3d023f <strcmp+463> mov rsi, qword ptr [rbp - 0x40]
0x3d0243 <strcmp+467> mov rcx, qword ptr [rbp - 0x38]
0x3d0247 <strcmp+471> xor r8d, r8d
1
2
pwndbg> telescope 0x7fffffffbb30-0x858
00:0000│ rdx 0x7fffffffb2d8 —▸ 0x7ffff7b376a0 (_IO_2_1_stdout_) —▸ 0xfbad2a84 ◂— 0x0
  • 最后执行 ASan 中的函数(ASan 已经劫持程序流了)
1
2
3
4
5
0x43ca69    call   __asan::ScopedInErrorReport::~ScopedInErrorReport()                      <__asan::ScopedInErrorReport::~ScopedInErrorReport()>
rdi: 0x7fffffffb280 —▸ 0x611000000107 ◂— 0x0
rsi: 0x7fffffffabe0 ◂— 0x7fff00000016
rdx: 0x690
rcx: 0x0

想要理解 ASan 的报错信息,可以参考以下博客:(这里就记录一下我的学习笔记)

shadow memory

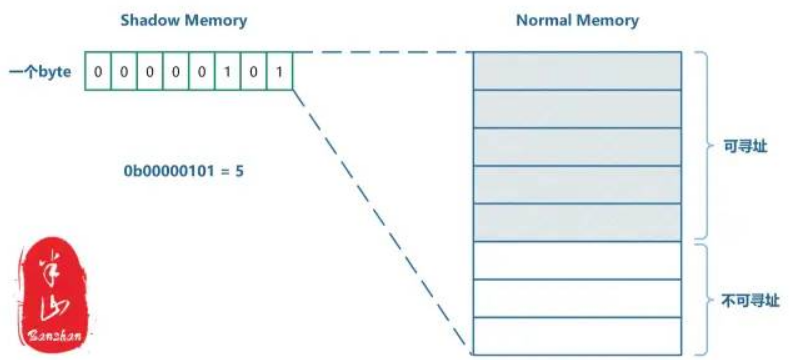
shadow memory 也是内存中的一块区域,但与 main memory 又不同,shadow memory 有中元数据的思想,其中的数据放映的是 main memory 的状态信息,因此,可以将 shadow memory 看做是 main memory 的元数据,而 main memory 中存储的才是程序真正的数据

Malloc 函数返回的地址通常是8字节对齐的,因此可以用9种状态,来表示8字节对齐的内存可访问(可寻址)状态:

  • 所有的8个字节都可寻址,shadow memory 值为0
  • 所有的8个字节都不可寻址,shadow memory 值为负数
  • 前 k(0≤k≤7) 个字节可寻址,剩下的 7-k 个字节不可寻址,shadow memory 的值为k

我们知道 malloc 函数返回的地址通常是8字节对齐的,因此任意一个由(对齐的)8字节所组成的内存区域必然落在以上9种状态之中,这9种状态便可以用 shadow memory 中的一个字节来进行编码

所有的8个字节都不可寻址其实可以继续分为多种情况,譬如:

  • Heap left redzone: fa
  • Freed heap region: fd
  • Stack left redzone: f1
  • Stack mid redzone: f2
  • Stack right redzone: f3
  • Stack after return: f5
  • Stack use after scope: f8
  • Global redzone: f9
  • Global init order: f6
  • Poisoned by user: f7
  • Container overflow: fc
  • Array cookie: ac
  • Intra object redzone: bb
  • ASan internal: fe
  • Left alloca redzone: ca
  • Right alloca redzone: cb
  • Shadow gap: cc

案例:

1
2
3
4
5
6
7
8
9
10
11
12
13
14
15
16
17
18
19
20
21
22
23
24
25
/**
* Copyright (c) 2021 junfu0903@aliyun.com.
*
* Unpublished copyright. All rights reserved. This material contains
* proprietary information that should be used or copied only within
* junfu0903@aliyun.com, except with written permission of junfu0903@aliyun.com.
*
* @file heap_buffer_overflow.c
* @brief
* @author junfu0903@aliyun.com
* @version 1.0.0
* @date 2021-06-15 10:18:45
*/

#include <stdio.h>
#include <stdlib.h>

int main(int argc, char** argv)
{
char *p = NULL;
p = (char*)malloc(16);
p[17] = 12;
free(p);
return 0;
}
1
gcc test.c -o test -fsanitize=address -fsanitize-recover=all -fsanitize=leak -no-pie -fno-omit-frame-pointer -g 

结果:

1
2
3
4
5
6
7
8
9
10
11
12
13
14
15
16
17
18
19
20
21
22
23
24
25
26
27
28
29
30
31
32
33
34
35
36
37
38
39
40
41
42
43
44
45
46
==6154==ERROR: AddressSanitizer: heap-buffer-overflow on address 0x602000000021 at pc 0x00000040121b bp 0x7fff11080090 sp 0x7fff11080080 /* 对应代码的位置 */
WRITE of size 1 at 0x602000000021 thread T0 /* heap中的溢出点 */
#0 0x40121a in main /home/yhellow/桌面/exp/shadow test/test.c:22
#1 0x7f9992b66082 in __libc_start_main ../csu/libc-start.c:308
#2 0x4010fd in _start (/home/yhellow/桌面/exp/shadow test/test+0x4010fd)

0x602000000021 is located 1 bytes to the right of 16-byte region [0x602000000010,0x602000000020)
allocated by thread T0 here:
#0 0x7f9992e41808 in __interceptor_malloc ../../../../src/libsanitizer/asan/asan_malloc_linux.cc:144
#1 0x4011db in main /home/yhellow/桌面/exp/shadow test/test.c:21
#2 0x7f9992b66082 in __libc_start_main ../csu/libc-start.c:308

SUMMARY: AddressSanitizer: heap-buffer-overflow /home/yhellow/桌面/exp/shadow test/test.c:22 in main
Shadow bytes around the buggy address:
0x0c047fff7fb0: 00 00 00 00 00 00 00 00 00 00 00 00 00 00 00 00
0x0c047fff7fc0: 00 00 00 00 00 00 00 00 00 00 00 00 00 00 00 00
0x0c047fff7fd0: 00 00 00 00 00 00 00 00 00 00 00 00 00 00 00 00
0x0c047fff7fe0: 00 00 00 00 00 00 00 00 00 00 00 00 00 00 00 00
0x0c047fff7ff0: 00 00 00 00 00 00 00 00 00 00 00 00 00 00 00 00
=>0x0c047fff8000: fa fa 00 00[fa]fa fa fa fa fa fa fa fa fa fa fa
0x0c047fff8010: fa fa fa fa fa fa fa fa fa fa fa fa fa fa fa fa
0x0c047fff8020: fa fa fa fa fa fa fa fa fa fa fa fa fa fa fa fa
0x0c047fff8030: fa fa fa fa fa fa fa fa fa fa fa fa fa fa fa fa
0x0c047fff8040: fa fa fa fa fa fa fa fa fa fa fa fa fa fa fa fa
0x0c047fff8050: fa fa fa fa fa fa fa fa fa fa fa fa fa fa fa fa
Shadow byte legend (one shadow byte represents 8 application bytes):
Addressable: 00
Partially addressable: 01 02 03 04 05 06 07
Heap left redzone: fa
Freed heap region: fd
Stack left redzone: f1
Stack mid redzone: f2
Stack right redzone: f3
Stack after return: f5
Stack use after scope: f8
Global redzone: f9
Global init order: f6
Poisoned by user: f7
Container overflow: fc
Array cookie: ac
Intra object redzone: bb
ASan internal: fe
Left alloca redzone: ca
Right alloca redzone: cb
Shadow gap: cc
==6154==ABORTING
  • 单步到 0x40121b 处:(程序提示的 0x40121b 就是发生溢出的地方)
1
2
3
4
5
6
7
0x401216 <main+96>     call   __asan_report_store1_noabort@plt                      <__asan_report_store1_noabort@plt>
rdi: 0x602000000021 ◂— 0x0
rsi: 0x1
rdx: 0x1
rcx: 0x7ffff7718d01 (__asan::instance+57089) ◂— 0x0

0x40121b <main+101> mov byte ptr [rbx], 0xc /* 溢出点 */

根据计算公式 Shadow = (Mem >> 3) + 0x7fff8000(64位):

  • mem 的地址 0x602000000021
1
2
In [3]: hex((0x602000000021>>3)+0x7fff8000)
Out[3]: '0xc047fff8004'
  • 得到 shadow memory 的地址是 0xC047FFF8004,刚好就是上图中由中括号括起来的 [fa](发生溢出的 heap 地址空间)
  • 而 0xC047FFF8002 和 0xC047FFF8003 两个 shadow memory 对应的值都为 0,说明这两个 shadow memory 对应的 main memory 是可寻址的(刚好就是 malloc(16) 申请的 0x10 字节的空间)

从这里也可以窥探到 [CVE-2018-16451] 的漏洞点,但是我把 crash 放入没有 ASan 的程序却复现不出漏洞(很头痛)