实验介绍 在本练习中,您将实现一对多逻辑回归和神经网络来识别手写数字
ex3.m - Octave/MATLAB 脚本帮助您完成第1部分
ex3 nn.m - Octave/MATLAB 脚本帮助您完成第2部分
ex3data1.mat - 手写数字训练集
ex3weights.mat - 神经网络训练的初始权重
submit.m - 提交脚本,将您的解决方案发送到我们的服务器
displayData.m - 帮助可视化数据集的函数
fmincg.m - 功能最小化例行程序(类似于fminunc)
sigmoid.m - Sigmoid 函数(假设陈述)
[?] lrCostFunction.m - 逻辑回归成本函数
[?] oneVsAll.m - 训练一个一对多类分类器
[?] predictOneVsAll.m - 使用一对多类分类器进行预测
[?] predict.m - 神经网络预测函数
Multi-class Classification(多类分类) 在本练习中,您将使用逻辑回归和神经网络识别手写数字(从0到9)
如今,自动手写数字识别被广泛使用——从识别信封上的邮政编码到识别银行支票上的金额
本练习将向您展示如何将所学的方法用于此分类任务
在练习的第一部分中,您将扩展以前的逻辑回归实现,并将其应用于 one-vs-all(一对多)分类
ex3data1.mat 中提供了一个数据集包含5000个手写数字训练示例(这个 mat 格式意味着数据已以 Octave/MATLAB 矩阵格式保存,而不是像 csv-file 那样的 ASCII 格式),可以使用 load 命令将这些矩阵直接读入程序,加载后,正确尺寸和值的矩阵将出现在程序的内存中,矩阵将已经命名,因此不需要为它们指定名称
ex3data1.mat 中有5000个训练示例,每个样例都是一个“手写数字”
其中每个训练示例的“手写数字”是20像素乘20像素灰度图像,每个像素由一个浮点数表示,表示该位置的灰度强度
20×20 的像素网格被“展开”成400维向量,这些训练示例中的每一个都成为我们的数据矩阵X中的一行
这给了我们一个 5000×400 的矩阵X,其中每一行都是“手写数字”图像的训练示例
训练集的第二部分是 5000 维向量y,其中包含训练集的标签
为了与 Octave/MATLAB 索引更兼容,在没有零索引的情况下,我们将数字0映射到值10,因此,“0”数字标记为“10”,而数字“1”至“9”按其自然顺序标记为“1”至“9”
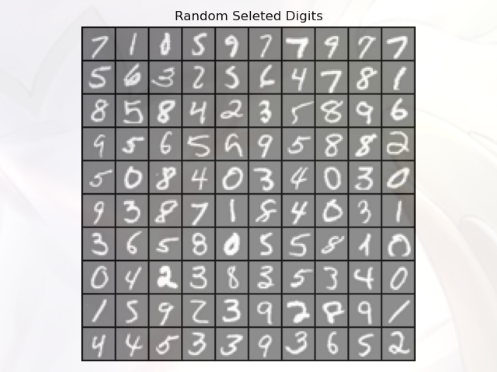
Visualizing the data(可视化数据) 您将首先可视化训练集的一个子集
在 ex3.m 的第1部分:代码从X中随机选择100行,并将这些行传递给 displayData 函数
此函数将每行映射到 20x20 像素的灰度图像,并一起显示图像
我们已经提供了 displayData 函数,我们鼓励您检查代码,看看它是如何工作的,运行此步骤后,应该会看到一个图像
先看一下 displayData 的实现:
1
2
3
4
5
6
7
8
9
10
11
12
13
14
15
16
17
18
19
20
21
22
23
24
25
26
27
28
29
30
31
32
33
34
35
36
37
import matplotlib.pyplot as pltimport numpy as npdef display_data (x ): (m,n) = x.shape width = np.round (np.sqrt(n)).astype(int ) height = (n / width).astype(int ) rows = np.floor(np.sqrt(m)).astype(int ) cols = np.ceil(m / rows).astype(int ) pad = 1 display_array = -np.ones((pad + rows*(height+pad), pad + cols*(width + pad))) current_image = 0 for j in range (rows): for i in range (cols): if current_image > m: break max_val = np.max (np.abs (x[current_image,:])) display_array[pad + j*(height + pad) + np.arange(height),pad + i*(width + pad) + np.arange(width)[:,np.newaxis]] = x[current_image,:].reshape((height,width)) / max_val current_image += 1 if current_image > m : break plt.figure() plt.imshow(display_array,cmap = 'gray' ,extent =[-1 ,1 ,-1 ,1 ]) plt.axis('off' ) plt.title('Random Seleted Digits' )
把输入的图像数据X进行重新排列,显示在一个面板 figurePane 中
面板中有多个小 imge 用来显示每一行数据
第一部分的代码:
1
2
3
4
5
6
7
8
9
10
11
12
13
14
15
16
17
18
import numpy as npimport scipy.io as scioimport matplotlib.pyplot as pltdata = scio.loadmat('data\ex3data1.mat' ) X = data['X' ] Y = data['y' ] print (X.shape) m = X.shape[0 ] rand_indices = np.random.permutation(range (m)) selected = X[rand_indices[0 :100 ],:] display_data(selected) plt.show()
shape:读取矩阵的长度
permutation(X):随机排列一个序列,或者数组
绘制的图像:
Vectorizing Logistic Regression(向量化逻辑回归) 现在我们要根据数据集来训练一个模型,使机器可以识别出这些“手写数字”对应的“真正数字”,这很明显是一个分类问题,并且还是多元分类,每个样本都有 10 种可能性(“0”~“9”)
您将使用多个 one-vs-all 逻辑回归模型来构建多类分类器:
因为有10个类,你需要训练10个独立的逻辑回归分类器
为了提高培训的效率,确保代码具有良好的矢量化非常重要
在本节中,您将实现逻辑回归的向量化版本(该版本不使用任何 for 循环)
其实在之前的实验中我们已经在使用向量化了(利用矩阵乘法来代替循环),这里实验要求使用
首先,我们先回忆一下逻辑回归-代价函数(交叉熵)的矢量版本:
因为需要求和,所以矢量版本的代码肯定有循环,但是向量版本却可以用“矩阵乘法”来替代循环:
代价函数 lr_cost_function:(带有正则化)
1
2
3
4
5
6
7
8
9
10
11
12
13
def lr_cost_function (X,Y,theta,lmd ): m = X.shape[0 ] g = sigmoid(X.dot(theta)) Y = Y.reshape(Y.size) cost = (-Y.T).dot(np.log(g)) - ((1 -Y).T).dot(np.log(1 -g)) cost = cost /(m) + lmd * (theta.T).dot(theta) / (2 *m) grad = (X.T).dot(g-Y)/ m grad[0 ] = grad[0 ] grad[1 :] = grad[1 :] + (lmd * theta[1 :])/m return cost,grad
PS:和前面 ex2 的 costfunction 相同(因为前面的实验都使用了向量化)
实现主体:
1 2 3 4 5 6 7 8 9 10 11 12 theta_t = np.array([-2 , -1 , 1 , 2 ]) X_t = np.c_[np.ones(5 ), np.arange(1 , 16 ).reshape((3 , 5 )).T/10 ] y_t = np.array([1 , 0 , 1 , 0 , 1 ]) lmda_t = 3 cost,grad = lr_cost_function(X_t,y_t,theta_t,lmda_t) np.set_printoptions(formatter={'float' : '{: 0.6f}' .format }) print ('Cost: {:0.7f}' .format (cost))print ('Expected cost: 3.734819' )print ('Gradients:\n{}' .format (grad))print ('Expected gradients:\n[ 0.146561 -0.548558 0.724722 1.398003]' )
set_printoptions:控制Python中小数的显示精度
One-vs-all Classification(一对多分类) 接下来就要实现多元分类的逻辑回归:
在这部分练习中,您将通过训练多个正则化逻辑回归分类器来实现一对所有分类,每个分类器对应于数据集中的K个类
1 2 3 4 5 6 7 8 lmd = 0.01 num_labels = 10 all_theta = one_vs_all(X,Y,num_labels,lmd) pred = predict_one_vs_all(X,all_theta) Y = Y.reshape(Y.size) print ('Training set accurayc:{}' .format (np.mean(pred == Y)*100 ))
模型拟合的具体过程在 one_vs_all 函数中,看看该函数的代码:
1
2
3
4
5
6
7
8
9
10
11
12
13
14
15
16
17
18
19
20
21
22
23
import scipy.optimize as optimport numpy as npfrom sigmoid import sigmoidfrom lrCostFunction import lr_cost_functiondef one_vs_all (X,Y,num_labels,lmd ): X = np.c_[np.ones(X.shape[0 ]),X] n = X.shape[1 ] all_theta = np.zeros((num_labels,n)) for i in range (1 ,num_labels+1 ): init_theta = np.zeros((n,1 )); y = (Y == i).astype(int ) def cost_func (t ): return lr_cost_function(X,y,t,lmd)[0 ] def grad_func (t ): return lr_cost_function(X,y,t,lmd)[1 ] theta, cost, *unused = opt.fmin_bfgs(f=cost_func, fprime=grad_func, x0=init_theta, maxiter=100 , full_output=True , disp=False ) all_theta[i-1 ,:] = theta.T return all_theta
最后看一下预测函数 predict_one_vs_all 的实现:
1
2
3
4
5
6
7
8
9
10
11
12
13
14
15
16
17
18
def predict_one_vs_all (X,all_theta ): m = X.shape[0 ] X = np.c_[np.ones(m),X] num_labels = all_theta.shape[0 ] preds = sigmoid(X.dot(all_theta.T)) P = np.zeros(m) for num in range (m): index = np.where(preds[num,:] == np.max (preds[num,:])) P[num] = index[0 ][0 ].astype(int ) + 1 return P
Neural Networks(神经网络) 在本练习的前一部分中,您实现了多类逻辑回归来识别手写数字,然而,逻辑回归不能形成更复杂的假设,因为它只是一个线性分类器
在这部分练习中,您将使用与之前相同的训练集实现一个神经网络来识别手写数字,神经网络将能够表示形成非线性假设的复杂模型:
本次实验,你们将使用我们已经训练过的神经网络的参数
您的目标是实现正向传播算法,使用我们的权重进行预测(已经训练好了)
在下次的实验中,您将编写学习神经网络参数的反向传播算法
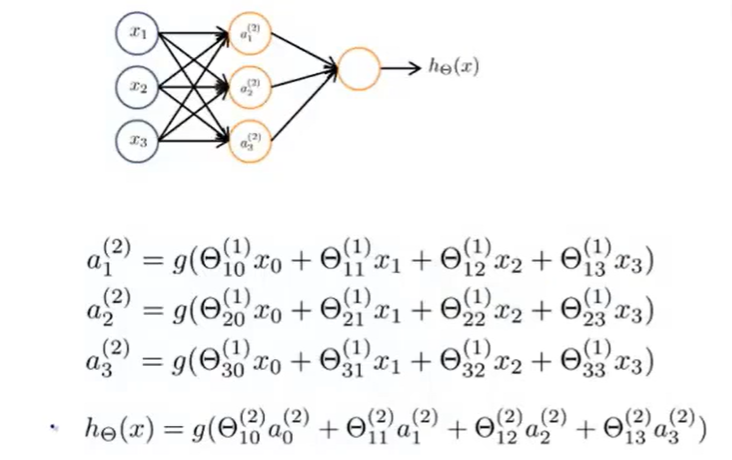
神经网络简图:(具体细节就不解释了)
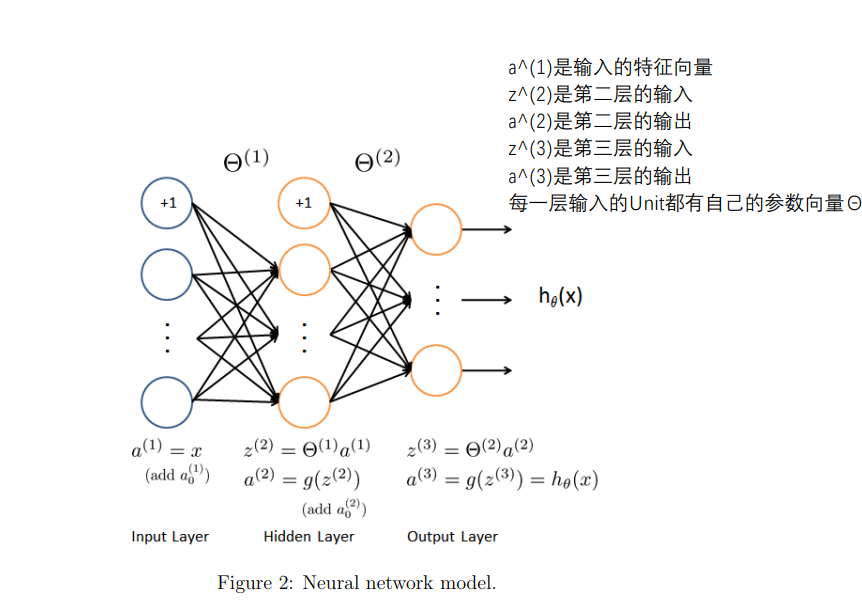
Model representation(模型表示) 对于本实验的神经网络架构:
这个神经网络有三层:输入层,隐藏层,输出层
我们的输入是数字图像的像素值,由于图像的大小为20×20,这给了我们400个输入层单元(不包括总是输出+1的额外偏置单元)
与之前一样,训练数据将加载到变量X和y中,我们已经向您提供了一组参数(θ(1),θ(2)),这些参数已经由我们训练过
这些都存储在 ex3weights.mat ,并将由 ex3_nn 加载到θ1和θ2,参数的尺寸为神经网络的尺寸,第二层为25个单元,输出为10个单元(对应于10个数字类)
Feedforward Propagation and Prediction(正向传播与预测) 现在,您将为神经网络实现正向传播,您需要在 predict 中完成代码,返回神经网络的预测
你应该实现正向传播算法,为每个示例 i 计算 hθ(x(i)) 并返回相关预测(类似于“一对多”分类策略)
下面是实现过程:
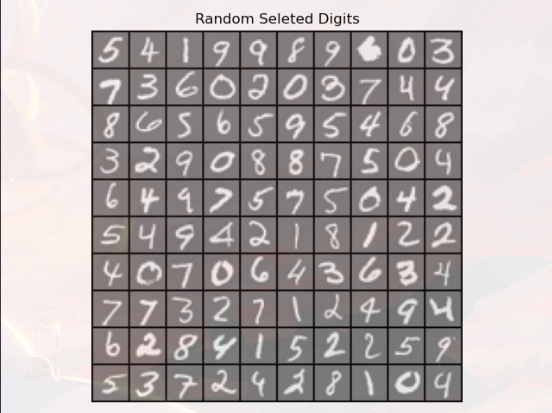
1 2 3 4 5 6 7 8 9 data = scio.loadmat('data\ex3data1.mat' ) X = data['X' ] Y = data['y' ].flatten() m = X.shape[0 ] rand_indices = np.random.permutation(range (m)) selected = X[rand_indices[1 :100 ],:] display_data(selected) plt.show()
1 2 3 4 5 6 7 8 9 weight = scio.loadmat('data\ex3weights.mat' ) theta1 = weight['Theta1' ] theta2 = weight['Theta2' ] P = predict_nn(X,theta1,theta2) print ('Training set accuracy: {}' .format (np.mean(P == Y)*100 ))
1 2 3 4 5 6 7 8 9 10 11 12 13 14 rp = np.random.permutation(range (m)) for i in range (m): print ('Displaying Example image' ) example = X[rp[i]] example = example.reshape((1 , example.size)) display_data(example) plt.show() pred = predict_nn( example,theta1, theta2) print ('Neural network prediction: {} (digit {})' .format (pred, np.mod(pred, 10 ))) s = input ('Paused - press ENTER to continue, q + ENTER to exit: ' ) if s == 'q' : break
预测函数 predict_nn 的实现:(有点不理解它为什么要这么组织代码)
1 2 3 4 5 6 7 8 9 10 11 12 13 14 15 16 17 18 19 20 21 def predict_nn (X,theta1,theta2 ): m = X.shape[0 ] X= np.c_[np.ones(m),X] z1 = theta1.dot(X.T) z1 = np.row_stack((np.ones(z1.shape[1 ]),z1)) A1 = sigmoid(z1) z2 = theta2.dot(A1) A2 = sigmoid(z2.T) P = np.zeros(m) for num in range (m): index = np.where(A2[num,:] == np.max (A2[num,:])) P[num] = index[0 ][0 ].astype(int ) + 1 return P
where(condition):满足条件(condition),输出满足条件元素的坐标
max(array):返回 array 的最大值
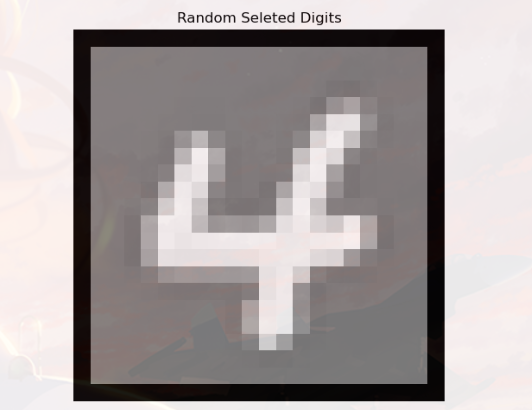
显示图片:
预期结果:
1 Neural network prediction: [4. ] (digit [4. ])
